
Table of Contents
Introduction
Null Hypothesis Significance Testing (NHST) is a statistical inference technique, commonly used by researchers to verify their obtained data and assumed hypothesis conditions. The discussion conducted through this essay emphasises the uses of NHST in comparison to the traditional statistical methods to provide a clear understanding of the various related concepts, such as p-value along with the 2 different kinds of errors (Type I and type II errors). It is a combined conceptual method, comprising the principles of both the Fisher’s and Neyman & Pearson’s Model that helps not only to infer the perspective of significance testing but also to assess the concepts of hypothesis acceptance and rejection. Using the NHST method, it is possible to test the experimental factor against no-effect hypotheses (Pernet, 2015). The essay, therefore, provides an in-depth understanding on the statistical factors based on the data analysis concepts of psychology along with the manner, in which the p-value of the significance testing can potentially safeguard the variables against the occurrence of type I errors.

Discussion
Concept of P-Value
The term ‘p-value’ refers to “the probability under the assumption of no effect or no difference (null hypothesis), of obtaining a result equal to or more extreme than what was actually observed” (Dahiru, 2008, p. 22). It fundamentally measures the likeliness between the differences based on ‘chance’ as observed amid the groups. The values are hence between 0 and 1, which if gets closer to 0 denotes unlikeliness as a result of chance and the closer it gets to 1, the level of likeliness tend to increase. This, in turn, helps in inferring the statistical significance and non-significance of the variables (Dahiru, 2008). P-Value is considered to be the resultant factor of NHST that is its end-product. It is one of the inferential statistics that is most predominantly evidenced in the researches of various fields, such as in the public health, behavioural, biomedical and social sectors (SJSU, 2016).
This concept of P-Value has been highly misinterpreted and misunderstood in the statistical domains. In order to keep these issues at the least, the data analysis is conducted in two different steps. In the first step, the Fisher’s model is used, as per which the data selected are tested using the approach of significance testing. Based on the results of this phase, the second step is put into use, which emphasises the incorporation of the Neyman-Pearson’s approach. In this phase, the tests are conducted for understanding the acceptance of the data, as illustrated below (SJSU, 2016; Perezgonzalez, 2015).
Figure 1: The Two Phases of Hypothesis Testing
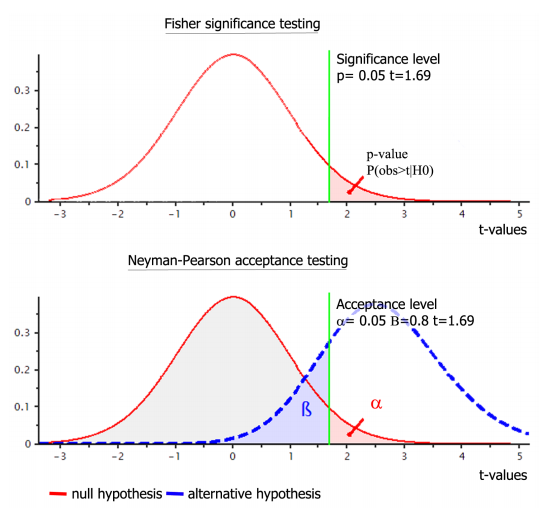

(Source: Pernet, 2015)
This finally leads to the last phase of the entire process, which emphasizes the combination of both these approaches to contribute to the formation of the new approach, i.e. the NHST, in which the previously found resultant are effectively portrayed considering the real-life scenario. In order to gather a clearer idea of the concept, the following notation can be taken into consideration (SJSU, 2016; Perezgonzalez, 2015).
P value ≡ Pr(data or data more extreme | H0 true); where
Pr ≡ probability
| ≡ “given” or “conditional upon”
H0 ≡ the null hypothesis
Through this notation, it can be understood that the P-values will provide an apparent answer to the question, “If the null hypothesis were true, what is the probability of observing the current data or data that is more extreme? (SJSU, 2016, p. 6.1)” The answer, in turn, provides an in-depth understanding of whether its assumption of the null hypothesis is correct and can be accepted (SJSU, 2016). There are principally three facets, which assist in depicting the acceptance or rejection of the hypothesis, including the resultant values of the probability factor p. In case the p-value is less than the alpha value, the null hypothesis gets rejected with the instant acceptance of the alternate one, while the value when becomes higher than the alpha represents the acceptance of the null hypothesis, thereby ignoring the alternate one completely. It can thus be stated that the smaller is the value the statistical significance of the relationship between the variables is proved to be higher (Mantravadi, 2013).
P<0.05 Safeguarding Type 1 Errors
Figure 2: Type I Error
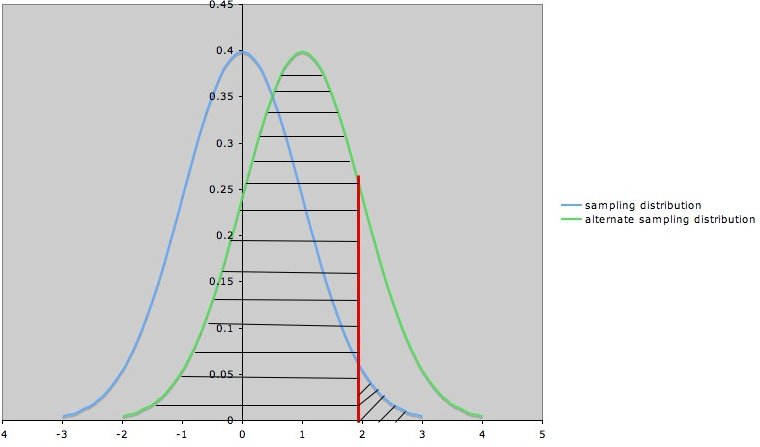
(Source: The University OF Texas, 2011)
| Index | |
| Indicators | Description |
| Blue Curve | Sampling Distribution (when null hypothesis=0) |
| Green Curve | Sampling Distribution (when alternate hypothesis=1) |
| Red Line | Boundary (null hypothesis gets rejected when the value goes beyond this line) |
| Shaded Area to the Right of the Red Line | Probability of type I error (α) |
Contextually, it had been discovered and emphasized by Fisher during 1930s as per his research that if the p-value is between 0.1-0.9, it implies there is no requirement for testing the hypothesis. However, something below 0.1 needs adequate testing and in this case, the value is found to be even lesser than 0.05 as per the significance level of 5%, it can be stated as the standard practice of identifying the variables to be statistically significant. As per the standard norm, stars were used to signify the values, which were less than 0.05, as for instance 1 star meant the p-value was less than 0.05, while 2 starts signified the value to be less than 0.01 and 3 stars was given only when the value of the factor P fell tremendously to less than 0.001. This process of inferring the position of the variable through stars was undoubtedly complex and hence a simpler approach was proposed by Jerzy Neyman as well as Egon Pearson, which was termed as the “Hypothesis tests”. Consequently, the interpretation method could even come across two errors, which might lead to deferred and distorted results altogether (StatsDirect Limited, 2017; Dahiru, 2008). These types I and II errors along with their relationship with the hypotheses have been explained in the form of a table below.
Table 1: Errors of Hypothesis testing
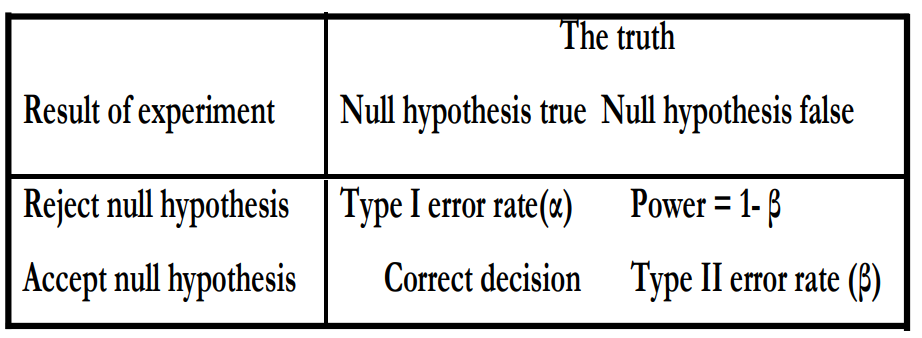
(Source: Dahiru, 2008)
Based on the results derived from the hypothesis testing, any of the two outcomes can be determined, i.e. either the null hypothesis needs to be accepted or the alternative one. Only one of the two hypotheses can be selected, which in turn helps to reduce the errors to the utmost level possible. In case a situation occurs when the null hypothesis needs to be accepted but is rejected by mistake, the result is termed as false-positive, which is denoted as the type I error, also known by the name of alpha error. In this case, a statistically significant difference is imagined irrespective of the fact that it does not exist in reality. Therefore, in such rejection requests, the notation can be stated as PRH (|H0 is true). On the other hand, if the rejected null hypothesis gets accepted as an error, the false-negative situation occurs with the error being termed as type II or beta error (University of California~Berkeley, 2014; Dahiru, 2008).
Type I error in the research paper takes into consideration the Alpha (α) as the significance level, the probability of which is the key factors leading to the occurrence of type 1 error. In this case, α value, as well as the confidence level, tends to become mutually exclusive. The confidence level is nothing but the opposite of the significance level, which refers to the chances of avoiding the type 1 error from occurring. This in turn increases the probability of the factors to reject the null hypothesis (Mantravadi, 2013a). The Type I error can further be avoided to a large extent using the facet of the p-value for hypothesis testing as the standard value is considered at 5% significance level that is 0.05. Taking this as the base, the acceptance or rejection of the null hypothesis is determined, which commits least possible occurrence of type I error. The reason behind this commitment is that only 5% chance is taken for the value to differ than expected, which therefore keeps the probability of the type 1 error within a negligible limit, as illustrated in the tabulated format below.
| P-Values | Interpretation |
| ≤0.05 | Null hypothesis rejected; alternate hypothesis accepted |
| >0.05 | Null hypothesis accepted |
Table 2: Interpretation of the P-Values to Safeguard the Occurrence of Type 1 Error
(Source: The Pennsylvania State University, 2018)
Conclusions
P-value acts as an essential facet of data analysis and hypothesis testing, since it was developed using the Fisher’s model. Later, the Neyman-Pearson’s approach was used for deriving more valid results in relevance to the p-value. However, in the present era, the NHST contributes largely to amalgamating the results of the previous two phases to gather a clear understanding of whether a null hypothesis is accepted or rejected. From the discussion in this essay, a clear inference has been obtained regarding the fact that type 1 error occurs largely when due to the increased probability of rejecting the null hypothesis and of accepting the alternate one. It is principally because of this fact that the standard significance level has been fixed as 5%, as per which there exist a limited chance for this error to take place with p-value≤0.05. Hence, it is proven that p< .05 is a safeguard against the type-1 errors.

- Mantravadi, S., 2013. Statistics for High School Students (AP Statistics). Author
- Mantravadi, S., 2013a. Fundamentals of Biostatistics for Public Health Students. Author.
- Perezgonzalez, J. D., 2015. Fisher, Neyman-Pearson or NHST? A Tutorial for Teaching Data Testing. Frontiers in Psychology, Vol. 6, pp. 1-11.
- Pernet, C., 2015. Null Hypothesis Significance Testing: A Short Tutorial. F1000Research, Vol. 4, No. 621, pp. 1-25.
- SJSU, 2016. Introduction to Null Hypothesis Significance Testing. P value., pp. 1-4.
- StatsDirect Limited, 2017. P Values. Basics. [Online] Available at: https://www.statsdirect.com/help/basics/p_values.htm [Accessed January 23, 2018].
- The Pennsylvania State University, 2018. Hypothesis Testing (P-Value Approach). Review of Basic Statistical Concepts. [Online] Available at: https://onlinecourses.science.psu.edu/statprogram/node/138 [Accessed January 23, 2018].
- The University OF Texas, 2011. Type I and II Errors and Significance Levels. Common Misteaks Mistakes in Using Statistics: Spotting and Avoiding Them. [Online] Available at: https://www.ma.utexas.edu/users/mks/statmistakes/errortypes.html Accessed January 23, 2018].
- University of California~Berkeley, 2014. Multiple Hypothesis Testing and False Discovery Rate. Lectures. [Online] Available at: https://www.stat.berkeley.edu/~hhuang/STAT141/Lecture-FDR.pdf [Accessed January 23, 2018].
- Downing, D. & Clark, J., 2003. Business Statistics. Barron’s Educational Series