
Table of Contents
Introduction
Correlation coefficient is an inferential statistics that establishes the relationship between two or more variables. Different types of correlation coefficient are used in the field of statistics. For example, Pearson’s correlation coefficient is used to estimate the relationship between quantitative variables. Likewise, spearman’s correlation coefficient is used to estimate the relationship between qualitative variables. A correlation coefficient can bear a value between -1 to +1 which includes 0. A positive correlation coefficient signifies that increase in magnitude of one variable would also increase the magnitude of the related variable and vice versa. On the other hand, a negative correlation coefficient signifies that increasing the value of one variable would decrease the magnitude of the related variable and vice versa. However, a “0” correlation coefficient signifies that there is no relation between the two variables for which the relation is being explored.
In this present study, the correlation between Gross Domestic Product (GDP) and rate of unemployment was being explored. GDP refers to the economic status of a country and represent the net cash flow there is available in the market (Coyle, 2014). It signifies the status of investments and expenditures made by the general public in the domestic market. GDP encompasses the fiscal parameters of the government those aim to nurture investment, developments (that can create job or address unemployment), and loans from the International Monetary Funds (Dawson, 2006). Hence, a part of the GDP represents the debt of a nation to such international financial institutions. This study explored one primary research question ‘whether GDP is significantly correlated with the unemployment rate?”. The research question was interpreted based on the acceptance or rejection of the experimental hypothesis. The study hypothesized that GDP would exhibit a negative correlation with unemployment rate.
Methodology
The data for the present study was obtained from www.tradingeconomics.com. The GDP and unemployment data of 16 nations were randomly selected from the referred website. The randomization was based on the basis of “developed” and “developing” nations. The data was presented and interpreted in the form of descriptive and inferential statistics. The descriptive statistics those were used include mean, median, mode, and bar diagrams. On the other hand, correlation coefficient was estimated as the inferential statistics for this study. All statistical analysis for the present study was conducted on a excel spreadsheet. The data for the present study is reflected in appendix-1. Since both GDP and unemployment rate are quantitative variables, a Pearson’s correlation coefficient was used to answer the research question.
Results
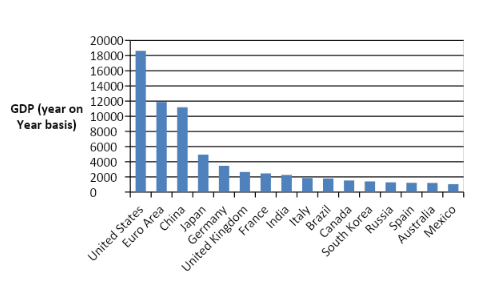
Fig 1: Shows the GDP of different countries. The data reflect that the United States has the highest GDP on a year on year basis.

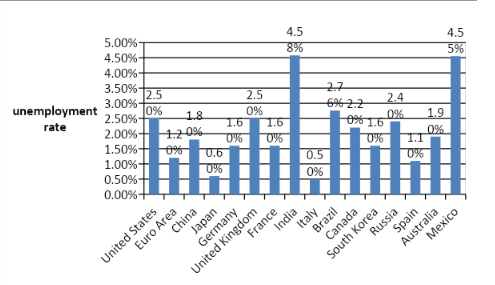
Fig 2: Shows the unemployment rate of different countries. The data reflect that India has the highest jobless rate followed by Mexico.
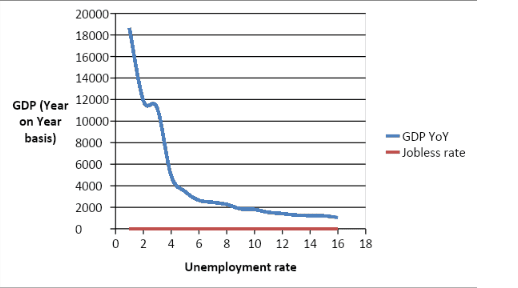
Fig 3; Shows the relation between GDP and unemployment rate. The graph indicates that GDP is inversely proportional to unemployment rate.
| GDP | Unemployment rate | |
| mean | 4302.938 | 2.086875 |
| standard deviation | 5090.077 | 1.169209 |
| median | 2057 | 1.85 |
| maximum | 18624 | 4.58 |
| minimum | 1047 | 0.5 |
Table 1: Descriptive statistics of the data
The descriptive statistics reflected that both GDP and unemployment rate exhibited radical fluctuations (as evident from standard deviation and range). Such finding is obvious based on the classification of developed and developing nation.
Excel spreadsheet-based correlation coefficient estimation
| GDP(x) | Unemployment rate (y) | x1-X1 | y1-Y1 | (x1-X1)*(y1-Y1) |
| 18624 | 2.5 | 14321.07 | 0.42 | 6014.849 |
| 11886 | 1.2 | 7583.07 | -0.88 | -6673.1 |
| 11199 | 1.8 | 6896.07 | -0.28 | -1930.9 |
| 4940 | 0.6 | 637.07 | -1.48 | -942.864 |
| 3467 | 1.6 | -835.93 | -0.48 | 401.2464 |
| 2648 | 2.5 | -1654.93 | 0.42 | -695.071 |
| 2465 | 1.6 | -1837.93 | -0.48 | 882.2064 |
| 2264 | 4.58 | -2038.93 | 2.5 | -5097.33 |
| 1850 | 0.5 | -2452.93 | -1.58 | 3875.629 |
| 1796 | 2.76 | -2506.93 | 0.68 | -1704.71 |
| 1530 | 2.2 | -2772.93 | 0.12 | -332.752 |
| 1411 | 1.6 | -2891.93 | -0.48 | 1388.126 |
| 1283 | 2.4 | -3019.93 | 0.32 | -966.378 |
| 1232 | 1.1 | -3070.93 | -0.98 | 3009.511 |
| 1205 | 1.9 | -3097.93 | -0.18 | 557.6274 |
| 1047 | 4.55 | -3255.93 | 2.47 | -8042.15 |
| Total sum= | -10256.1 |
Pearson’s correlation coefficient is calculated from the excel spreadsheet as;
R= sum of (x1-X1)*(y1-Y1)/ (n-1)* (standard deviation of x)*(standard deviation of y)
Where x and y are the raw data for GDP and unemployment rate respectively
N = sample size =16
X1= mean of GDP
Y1= mean of unemployment rate
Replacing the values of the variables from descriptive statistics and the excel spreadsheet:
= -10256.1/[(16-1)(5090.07)(2.08)
= -0.064.
Hence, the Pearson’s correlation coefficient between GDP and unemployment rate is -0.064.
Discussion and Conclusion
Such findings indicate that GDP is negatively correlated with unemployment rate. Hence, the present study supports the hypothesis that GDP exhibits a negative correlation with unemployment rate. In other words, it indicates that whenever the GDP of a nation would improve it will reduce the unemployment rate in that nation. However, the respective nation should be sensitized regarding the debt as a component of GDP before making provision for employments and jobs. However, employment creation could itself boost the economy of a nation as it would ensure more cash flows into the domestic market (Holcombe, 2004). On the other hand, the investments that would be supported as a component of higher GDP would attract employees. Finally, development of human resources as employees or unemployed individuals could expedite foreign direct investment or creation of outsourced jobs (Nussbaum, 2013). Such initiatives would reduce the debt component of debt, and at the same time would ensure sustained employment for the respective nation.
Appendix-1
| GDP YoY | Jobless rate | |
| United States | 18624 | 2.50% |
| Euro Area | 11886 | 1.20% |
| China | 11199 | 1.80% |
| Japan | 4940 | 0.60% |
| Germany | 3467 | 1.60% |
| United Kingdom | 2648 | 2.50% |
| France | 2465 | 1.60% |
| India | 2264 | 4.58% |
| Italy | 1850 | 0.50% |
| Brazil | 1796 | 2.76% |
| Canada | 1530 | 2.20% |
| South Korea | 1411 | 1.60% |
| Russia | 1283 | 2.40% |
| Spain | 1232 | 1.10% |
| Australia | 1205 | 1.90% |
| Mexico | 1047 | 4.55% |

- Coyle, D (2014). GDP: A Brief but Affectionate History. Princeton University Press, 6
- Dawson, G (2006). Economics and Economic Change. FT / Prentice Hall. 205
- Holcombe, G. (2004). “National Income Accounting and Public Policy”. Review of Austrian Economics. 17 (4), 387–405
- Nussbaum, M. (2013). Creating capabilities : the human development approach. Cambridge, Mass.: Belknap Press of Harvard University Press.