
Table of Contents
Introduction
A product portfolio is one of the most important elements in an organisation. It entails all the goods or services that an organisation offers. Companies understand the importance of managing these products since they are the determinants of success or failure (Prasad, 2016, 1). Moreover, having a product portfolio management helps the organisation in determining the best ways to realise profitability (Kraiczy, Hack and Kellermanns, 2014, 1070). As such, a product portfolio helps in strategising where the company needs to invest or divest resources. Many firms nowadays focus on diversifying their products to suit customers’ needs as well as increase revenues from sales (Nicholas and Steyn, 2017, 65). A product portfolio consists of a collection of services and outputs that a company offers or plans to offer its target market. Through a product portfolio analysis, a company can have a nuanced view of the types of stock offered, growth prospects, income sources, profit margin drivers, operational risks and market leadership (Teller, Kock, and Gemünden, 2014: 72). Such assist investors not only in making the right decision but also in conducting equity research or even analysis to determine the best way to gain competitive advantage (Shoham and Paun, 2015, 55). The product portfolio is also essential in performing financial analysis since it provides not only the context but also granularity of the business (Nicholas and Steyn, 2017, 65). This helps investors in distinguishing between short-term opportunities for growth and long-term stock value (Beringer et al. 2013: 834). The portfolio analysis further provides the investors with the opportunity to identify the primary financial performance drivers as well as the best way to model these drivers to achieve maximum benefit. This paper provides a precise analysis of the essence of an organisation’s product portfolio while delving into two portfolio matrixes namely the BCG matrix and GE-Kinsey nine-box matrix.
The BCG Matrix
Fig. 1
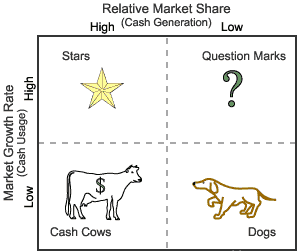
(Berg, Pietersma & Assen, 2015)

Bruce Henderson developed the BCG growth-share matrix portfolio-planning model in the 1970s (Mallin & Finkle, 2011). The model is founded on the observation that Bruce made that the business units of a company can be placed into four categories based on the combinations of market share and market growth relative to the biggest competitor (Guta, 2017, 358). The market growth provides a proxy for the attractiveness of the industry. On the other hand, the relative market share provides a proxy for the company’s competitive advantage (Shanbhag, Dutt & Bagwe, 2016). As such, it is evident that the growth-share matrix helps in mapping the position of the enterprise’s business units within these two significant factors that determine profitability (Shanbhag, Dutt & Bagwe, 2016). The assumption that the growth-share matrix makes is that a company that experiences increasing relative market share also increases its cash flow (Kuvaeva, 2013). The assumption in most cases is correct since the experience curve shows that an increase in the relative market share ultimately implies that the firm is on an upward trajectory (Mallin & Finkle, 2011). Moreover, it means that the corporation’s growth is relative to that of its competitors in the experience curve thus, a positive change in cost advantage (Schultz, Salomo & Talke, 2013; 101). The second assumption that the matrix makes involves the need that the growing market has of assets and investments (Mallin & Finkle, 2011). This need focuses on the requirement of the company to grow its capacity which, in turn, will result in increased expenditure. Hence, the Matrix’s positioning of a firm’s business units helps in the provision of an indicator that shows the generation of cash against consumption (Madsen, 2017). Therefore, to depict its ability in analysing the business units of a company, Apple Inc. and Samsung will be offered as examples.
The Four Categories In Relation To Apple
Fig. 2
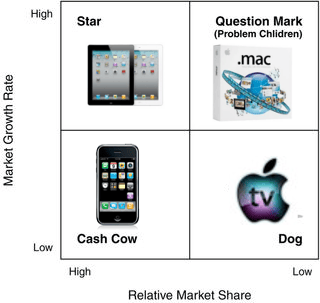
(Manifested Marketing, 2012)
The four classes in the matrix are question marks, dogs, rising stars and cash cows. Regarding question marks, Apple TV makes some money for the company; nevertheless, it is not achieving its intended full potential. The only way that this product can reach its full potential is by solving a couple of ecosystem issues that Apple is facing (Mallin & Finkle, 2011). Through doing this, the company can easily own and dominate the TV market. The company’s television product is necessarily great and has similar characteristics that can be dominant in the TV market just as its iPhone/iPod/iPads are having in their respective markets. On the other hand, the company’s rising stars involves the iPads and the firm’s iPhone products. It is evident that the company’s consumer base just cannot have enough of these products and hence, the company continues to make more and more of these commodities. Therefore, essentially, these products are evidently successful. Moreover, their growth and capacity potential is unknown. In the company’s 2016 fiscal year, Apple sold 211.88 million iPhone units. In the recent quarter, the company sold 50.76 million units globally (Statista, 2017). Apple’s cash cows are its Mac Books. The reason behind this is that in the market, the current choice of portable computing technology is the Mac Books (Mallin & Finkle, 2011). The company has input in the Mac Books an all in one product and hence, this places it in the cash cow place. Moreover, considering that in spite of the company making many of these products, computing has been quickly shifting to mobile and hence, this puts the result in the dog category. Finally, the dog’s section is pumped up with the company’s large multi-part desktop, which is evidently fading away (Whitehead, 2015, 1). It is further clear that the iPods hard drives peaked a while back. Moreover, many competitors nowadays can make simple products like the iPod. On the other hand, the company’s Mac Books are considered in this category since the company does not lead in this particular market segment. The reason that Apple is not the market leader in this segment is that many of its competitors have monopolised this desktop market.
Four Categories in Relation to Samsung
It is evident that Samsung is one of the most renowned companies that have continued to operate successfully in the electronics industry. Samsung has different business units which can be analysed through the BCG matrix. The company’s analysis of the four categories will be presented below.
In the BCG matrix, mature organisations have different business units that contribute to either success or failure (Khan, Alam and Alam, 2015, 957). In this case, Samsung has a business unit, which is part of the mature industry and can be categorised as its cash cow. It is important to understand that the main feature of a product or business to pass qualifications as the cash cow resonates on that it will not only be a resource that the company considers as that requiring an intensive production process. Nevertheless, the company views it as a high return investment (McNally, Durmuşoğlu and Calantone, 2013, 250). It is evident that with the slow speed at which the industry is expanding is a great indication that the businesses operating in this particular environment have a little likelihood to garner a high market share (Wang, 2017). However, the market share that exists is high enough to increase the organisation’s sales. In this case, Samsung’s cash cows are its home appliances category. The company through this segment has continually been able to reach a high number of regions in the international market. It has been able to sell many of its home appliances in various places (Wang, 2017). The company’s management garners the recognition that it can ably establish a firm hold in the global home appliances domain (Shanbhag, Dutt & Bagwe, 2016). Their acknowledgment of this ability has resulted in the decision it has made concerning the promotion of these products all over the international markets (Wang, 2017). The reason that Samsung’s cash cow is its home appliances segment is that this is its primary unit that does not require great investments not only regarding creativity but also regarding offering new technology on a frequent basis (Liu, Fong & Lan, 2017). Samsung has continually proven itself as an innovative and creative technological company. Nevertheless, in this segment, the company has not focused much on investing in the creation of new product features (Shanbhag, Dutt & Bagwe, 2016). However, the company has continually realised a high market share in this segment alone. For example, the refrigerator carries features that allow for the adjustability of temperatures in various compartments therein. Therefore, this makes it a greatly appealing product not only for the company’s customer base but also for its target market (Shanbhag, Dutt & Bagwe, 2016). Hence, it is evident that the home appliances section of the company’s business is identifiable as the organisation’s cash cow.
On the other hand, the BCG matrix holds a category known as the star (McNally, Durmuşoğlu and Calantone, 2013, 250). The stars in this pattern are a representation of the market that is evolving within the industry and hence, it offers prospects for the company to grow its businesses. Hence, out of this understanding, companies are always motivated in seeking to invest in these categories to ensure that it develops the units more and more (Wang, 2017). The aim behind this is to garner a higher market share in comparison to its competitors as well as to attain a greater market position using the units (Liu, Fong & Lan, 2017). In relation to Samsung, the company’s star includes not only its mobile phones but also its tablets. The company has continually made increasing efforts to ensure that it adequately deals with the pressure it gets from its competitors in this business segment (Khan, Alam & Alam, 2015). It is important to note many mobile phone manufacturers exists in this industry; hence, the company faces immense pressure from them. Nevertheless, the understanding that Samsung garners concerning the importance of this market segment to its business has helped the company to invest continually its resources with the aim of expanding its presence in this segment (Seifert, Tancrez & Biçer, 2016). It is further evident that Samsung’s management has ably achieved this particular objective through making the organisation stand out in the global market as one of the major mobile phone suppliers (Michell, 2010). The cell phone industry is an industry that evidently experiences rapid technological growths and changes, which is a continuance indication that the market is one that is in its growth phase (Liu, Fong & Lan, 2017). The company continues to introduce new technologies in this market through ensuring that it incorporates new features in its tablets and smartphones. Samsung has always manufactured new mobile phones and has always aimed at adding a new function or features in its new creations to ensure that it not only appeals it target markets but that it also helps them stand out against its competitors. The company’s other star in the BCG matrix is its plasma television. This product has continually gained significant sales for the company, more so, in the international market (Liu, Fong & Lan, 2017). The company holds a strong position in the TV market through its plasma TV (Michell, 2010). An investment in this segment can be a great long-term source for the company to continue garnering profits in years to come (Liu, Fong & Lan, 2017). Similarly, to the mobile phone technology, the technology that is being experienced in the TV production and design is that, which is growing and evolving and hence, is propelling companies based in this industry to adapt successfully and more efficiently. Samsung has shown excellent adaptation through the features it adds to its Smart TV.
Also, in the BCG matrix, the question marks are a representation of the positions that the organisation has not been able to create significance since they are still in the developmental phase (Kuvaeva, 2013). The company’s small market share makes even the future of the given product uncertain and hence, the company does not make significant investments in this domain to avoid risking its resources (Go, 2015). Samsung’s products that fall under these premises are its printers since they cannot primarily earn money for the printer (Michell, 2010). Nevertheless, if the company can make improvements on its printers, then these products can be categorised among its strongest suits. The other question marks it has concerned its Galaxy 7, which overheated and led to severe consequences (Michell, 2010). Hence, such issues led to the negative branding of the company’s image and hence, the future of the galaxy series may be uncertain.
Finally, the dog that the enterprise’s business units have is the Galaxy smart watches, which is one of their products that have not been able to gain market recognition (Liu, Fong & Lan, 2017). It is evident that even its target markets have not given it the desired attention (Go, 2015). Evidently, the smart watch also has some flaws in the way it functions and hence, this has made it gain a little preference in the market (Michell, 2010). For example, the watch needs to be charged daily, which is an unappealing element. Additionally, it is bulky in appearance, hence making it more unattractive.
We can do it today.
Limitations
It is evident that this matrix led to the creation of other models because it had many flaws that hindered it from perfectly displaying the profitability growth of companies (Liu, Fong & Lan, 2017). One of the reasons that this matrix, which was once made used all around the world faded from its popularity is that it overlooks other factors that lead to profitability within the company (Mallin & Finkle, 2011). The matrix only holds two factors endearing, namely, the growth rate of the market as well as the company’s relative shares in the market (Roberts, 2012). The growth rate of the market is only but one factor that depicts the attractiveness of the industry while the relative shares that a company has in the market are but only one factor that shows its competitive advantage (Liu, Fong & Lan, 2017). The other assumption that limits this framework is that each business unit within a company is independent. It is important to note that in various cases the products in the dog categories help other business units to garner a competitive edge over other products in the market. The other limitation that this matrix faces is that it highly depends on the breadth of the market definition (Roberts, 2012). The unit of a business helps it dominate a small niche in the market (Mallin & Finkle, 2011). Nevertheless, it is significant to note that these have minimal shares in the market in the entire industry. Hence, in such cases, the market’s definition changes and differs from the cash cow to the dog category. Nevertheless, since the BCG matrix’s significance has continually diminished, companies can still make use of this tool to understand its portfolio at one look. Ultimately, the model can serve as the start point for the company’s management in discussing how it will allocate its resources among its strategized business units.
The GE-McKinsey Nine-Box Matrix
Fig. 3
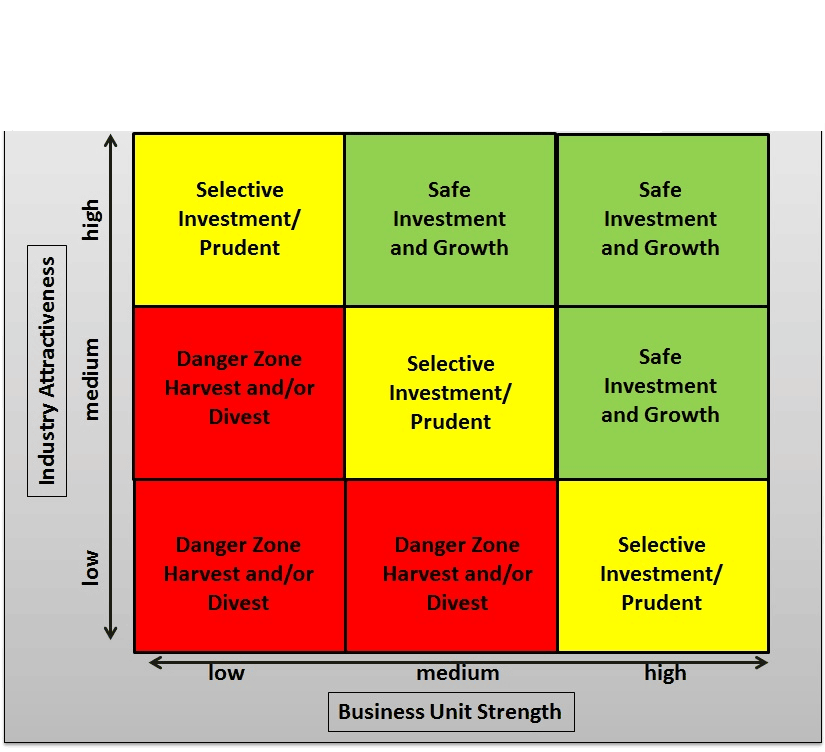
(Berg, Pietersma & Assen, 2015)
As mentioned before, the limitations that the BCG matrix faced led to the development of other models that were more enhanced in comparison to the latter. One of these matrixes was the GE-McKinsey Nine-Box matrix. The McKinsey consulting company created it in the 70s for GE. The GE Company (General Electric) was an umbrella corporation that managed many unrelated and complex products. The company had experienced dissatisfaction from its returns on investment from the many products it managed (Roberts, 2012). The company made its investment decisions based on different projections like the flow of cash in the future as well as the rate of market growth among many others. Nonetheless, the company realised that its projects were still inaccurate and unreliable. Hence, after the company brought McKinsey on board, they designed the nine-box matrix. About Apple, this model can be easily applied to its products. The application of this pattern therein evidently reveals a fascinating picture of the company (Roberts, 2012). It is known that the firm has different business units, which operate in various markets. Its business units include laptops, desktop computers, portable music devices, tablets, watches, TVs, and Smartphones among others (Roberts, 2012). Therefore, using the matrix, it is easy to determine the units the company has a higher likelihood of investing in or divesting or even selectively developing. The attractiveness of the market is determined by external factors like the size of the market, the growth rate of the market, entry barriers, as well as the state of technological growth in the industry (Roberts, 2012). The strength of the business units was difficult to determine since it utilises internal elements of the firm such as access to resources, customer loyalty, as well as the management’s strength among others.
The GE matrix depicts that Apple Inc. remains moderately high or very active in each business unit that it has (Roberts, 2012). The company moreover, is continually competing for many attractive and highly growing segments in the market like Smartphones and tablets. These said units have a great likelihood of being continually invested in rather than be divested. Hence, the company might feed them of the revenue that the cash cows like iPods and PCs are generating (Roberts, 2012). Nonetheless, many barriers to entry exist in the high-technology markets. Hence, for the company to enter into new markets, it requires substantial investment to garner not only the necessary technology but also the needed expertise. In spite of Apple Inc.’s dominance in the tech industry, the company’s best segments that it can use to compete with are the new markets, whose growth rates are faster. Some of the markets that it can focus on are the Smartphones market segment and the tablet’s market segment.
Samsung Analysis
Samsung evidently ranks among the best technology companies globally (Chen and Ann, 2016: 232). The company has numerous products and business units that drive its revenues and ultimately its overall success. Its mobile phone business unit is quite attractive (Chen and Ann, 2016: 232). It holds a high attractiveness score that shows this particular group is of great importance to the company’s success. Its high-level positioning in the matrix shows it falls under the leader-type business (Chen and Ann, 2016: 232). The company’s smartphones hold a relatively high market share position in the market. On the other hand, Samsung’s TV market also has a considerably strong attractiveness degree. Nevertheless, this business unit can be categorized at the middle level of the matrix. The reason is that it requires massive resources to be invested in making it rise into the leader-type of business unit that it can be. However, its survival in this market will be difficult considering that it faces fierce competition.

On the other hand, Samsung’s washing machines have a sound level of attractiveness (Choi et al. 2016). Nevertheless, its production strength is weak and hence, raises questions regarding its operations. The company faces an increasingly fierce competition in this market. The entry level is easy, and this has allowed others to venture therein thereby creating room for competition. Both well-known brands and upcoming ones compete for a share of both the international and domestic market hence, heightening the level of competition. Therefore, it is critical to note that the company is in a challenging position in this business unit. Ultimately, this unit requires a substantial investment from the firm to make it flourish and rank among the leader-type business unit the company needs.
It is evident that mature companies in comparison to growing ones have a diverse product portfolio, which they maximally use to their advantage. Acquisitions and internal product development help in contributing to the size of the product collection that a business has over time. It is evident from the analysis conducted on that bigger companies have the needed infrastructure to offer the support necessary to broaden the product range. Moreover, the other driver that can increase the product portfolio is geographic expansion. Geographic expansion leads a company’s research and development team to venture into the area, city, or even country that the organisation desires to enter and determine the popularity of the products therein and the views of the target market concerning these commodities. From this, the company can determine the need degree of diversifying their products to enable it to expand and reach out to new markets. Nevertheless, the downside of diversification is the limit it places on the growth potential of companies since firms need to not only show less volatility in their operations but also need to ensure they reduce the risks associated with diversification. Doing this helps in ensuring the reduction of the speculation amount placed in the valuation of a company’s equity. A good example in this context is the Proctor & Gamble Company. P&G has 65 different well-known household and personal goods brands such as Tide, Crest, and Bounty. Hence, it is vital for companies to focus not only to manage their product portfolio but also to continue diversifying their products and investing in the products that can increase their profits, revenues as well as their market share.
- Berg, G., Pietersma, P. & Assen, M. 2015. Key management models : the 75+ models every manager needs to know. Harlow, England New York: Pearson. Retrieved on 21 Jul. 17, from https://www.safaribooksonline.com/library/view/key-management-models/9781292016276/
- Beringer, C., Jonas, D. and Kock, A. 2013. Behaviour of internal stakeholders in project portfolio management and its impact on success. International Journal of Project Management, (6), pp. 830-846. Retrieved on 17 July 2017, from www.sciencedirect.com/science/article/pii/S0263786312001627
- Chen, C.M. and Ann, B.Y., 2016. Efficiencies vs. importance-performance analysis for the leading smartphone brands of Apple, Samsung and HTC. Total Quality Management & Business Excellence, 27(3-4), pp.227-249.
- Choi, H.S., Hwang, J.H., Yoon, K.S., Choi, J.W. and Cho, T.H., Samsung Electronics Co., Ltd., 2016. Washing machine. U.S. Patent D747,575. Retrieved on 21 Jul. 17, from https://www.google.com/patents/USD747575
- Go, S.J. 2015. Strategic analysis of Samsung’s smartphone product portfolio: countering the challenge from Chinese competitors (Doctoral dissertation, Massachusetts Institute of Technology). Retrieved on 17 Jul. 17, from https://dspace.mit.edu/handle/1721.1/99007
- Guta, A.J., 2017. The analysis of strategic alternatives using BCG matrix in a company. Calitatea, 18(S1), p.358. Retrieved on 17 July 2017, from https://search.proquest.com/openview/c49329e835e7fefb06a21be4f86da9e2/1?pq-origsite=gscholar&cbl=1046413
- Khan, U.A., Alam, M.N. and Alam, S. 2015. A critical analysis of internal and external environment of Apple Inc. International Journal of Economics, Commerce and Management, 3(6), 955-961. Retrieved on 17 July 2017, from https://www.researchgate.net/publication/282274921_A_CRITICAL_ANALYSIS_OF_INTERNAL_AND_EXTERNAL_ENVIRONMENT_OF_APPLE_INC
- Kraiczy, N.D., Hack, A. and Kellermanns, F.W., 2014. New product portfolio performance in family firms. Journal of Business Research, 67(6), pp.1065-1073. Retrieved on 17 July 2017, from www.sciencedirect.com/science/article/pii/S0148296313002609
- Kuvaeva, T., 2013. The BCG Matrix. Retrieved on 16 Jul. 17, from http://ir.nmu.org.ua/bitstream/handle/123456789/2557/Kuvaeva%20T.,%20Urgel%20E..pdf?sequence=1
- Liu, S.J., Fong, H.A. and Lan, Y.T. 2017. Patent portfolio deployment: bridging the r&d, patent and product markets. World Scientific. Retrieved on 17 July 2017.
- Madsen, D.Ø., 2017. Not Dead Yet: The Rise, Fall and Persistence of the BCG Matrix. Retrieved on 16 Jul. 17, from https://papers.ssrn.com/sol3/papers.cfm?abstract_id=2954610
- Manifested Marketing. 2012. Apple – An introduction to Marketing Strategy. Retrieved on 21 Jul. 17, from https://manifestedmarketing.wordpress.com/2012/03/29/apple-an-introduction-to-marketing-strateg/
- Mallin, M.L. and Finkle, T.A. 2011. Apple Inc.: product portfolio analysis. Journal of the International Academy for Case Studies, 17(7), 63. Retrieved on 17 Jul. 17, from https://www.researchgate.net/…/264786373_Apple_Inc_Product_portfolio_analysis
- McNally, R.C., Durmuşoğlu, S.S. and Calantone, R.J., 2013. New product portfolio management decisions: antecedents and consequences. Journal of Product Innovation Management, 30(2), pp.245-261. Retrieved on 17 Jul. 17, from onlinelibrary.wiley.com/doi/10.1111/j.1540-5885.2012.00997.x/pdf
- Michell, T. 2010. Samsung Electronics: and the struggle for leadership of the electronics industry. John Wiley & Sons. Retrieved on 17 July 2017.
- Prasad, K.R., 2016. An Effective Study on Strategic Portfolio Analysis. Imperial Journal of Interdisciplinary Research, 2(6). Retrieved on 17 Jul. 17. www.onlinejournal.in/IJIRV2I6/276.pdf
- Roberts, J.H. 2012. 10 New product development in a strategic context. handbook of Marketing Strategy, 172. Retrieved on 17 Jul. 17.
- Schultz, C., Salomo, S., & Talke, K. (2013). Measuring new product portfolio innovativeness: how differences in scale width and evaluator perspectives affect its relationship with performance. Journal of Product Innovation Management, 30(S1), 93-109. Retrieved on 17 Jul. 17 from onlinelibrary.wiley.com/doi/10.1111/jpim.12073/abstract
- Seifert, R.W., Tancrez, J.S. and Biçer, I. 2016. Dynamic product portfolio management with life cycle considerations. International Journal of Production Economics, 171, 71-83. Retrieved on 17 Jul. 17, from www.sciencedirect.com/science/article/pii/S0925527315003989
- Shanbhag, M., Dutt, M. L., & Bagwe, S. (2016). Strategic Talent Management: A Conceptual Analysis of BCG Model. Imperial Journal of Interdisciplinary Research, 2(7). www.imperialjournals.com/index.php/IJIR/article/view/1166
- Shoham, A. and Paun, D., 2015. Small business marketing strategies: A call for customization. In Proceedings of the 1993 Academy of Marketing Science (AMS) Annual Conference (pp. 553-557). Springer, Cham. Retrieved on 17 Jul. 17 from https://link.springer.com/chapter/10.1007/978-3-319-13159-7_120
- Statista. 2017. Global Apple iPhone sales from 3rd quarter 2007 to 2nd quarter 2017 (in million units). Retrieved on 20 Jul. 17, from https://www.statista.com/statistics/263401/global-apple-iphone-sales-since-3rd-quarter-2007/
- Teller, J., Kock, A. and Gemünden, H.G. 2014. Risk management in project portfolios is more than managing project risks: a contingency perspective on risk management. Project Management Journal, 45(4), pp. 67-80. Retrieved on 17 Jul. 17 from onlinelibrary.wiley.com/doi/10.1002/pmj.21431/abstract
- Wang, P. 2017. Innovation is the new competition: product portfolio choices with product life cycles. Retrieved on 17 Jul. 17, from sites.google.com/site/willpeichunwang/JMP.pdf
- Whitehead, J., 2015. BCG (Growth Share) Matrix. Wiley Encyclopedia of Management. Retrieved on 17 Jul. 17, from http://onlinelibrary.wiley.com/doi/10.1002/9781118785317.weom090346/abstract;jsessionid=ABA220577790C8D2360A3A892D757980.f04t03?userIsAuthenticated=false&deniedAccessCustomisedMessage