
Table of Contents
Introduction
There has been a great assumption in the investigation of the variations in fear of crime between women and men resulting in measurement invariance. Previous studies concerned with measurement invariance between men and women, bring out gender as a factor worth consideration in the prediction of personal fear of crime. According to Lane (2012), gender has remained a great predictor of personal fear of crime over the years. In particular, women have almost always been more afraid of crime regardless of how, where, or when it is measured. Additionally, studies in different parts of the world including England, United States, and Greece among others have indicated that women are more fearful of crime (Lane, 2012). Barkan (2011) revealed that close to 46% of American women feared walking alone at night, unlike 17% of men. The major contributing factor to high levels of fear among women was because they had higher chances of being crime victims compared to men including rape. Consequently, the fear of crime among women reflected their being of sexual assaults and rape (Barkan, 2011). The four major hypothetical ideas regarding increased personal fear of crime among women are patriarchy, physical vulnerability, outstanding effect of perceived threat of rape, and differential socialization. Patriarchy revolves around increased social and physical power, and gender inequality among men. Within male-dominated societies, women experience heightened fear with their ordinary lives requiring them to be worried about safety. Hilinski (2009) reveals that for women, unlike men, the fear of rape predicts other kinds of fear especially because of the emotional and physical outcomes that could result if such harm was to occur. Differential socialization contributes to the socialization of women as weak and submissive thus contributing to women not feeling strong enough to protect themselves from crime. Additionally, women are physically more vulnerable to victimization and there after being hurt upon victimization.
According to Bridge (2013), people living in rural areas in Britain are more optimistic regarding the future compared to those living in urban areas. Unlike those in rural areas, people in urban areas were more worried about crime compared to those in the countryside. The British Crime Survey or BCS reveals that crime and risk of being a victim of crime is lower in rural areas. Some of the factors that contribute to generally lower rural crime rates and fear of crime include higher incomes, the rural communities often being closely-knit in nature, and higher levels of employment and education. The variations in concern regarding crime in both rural and urban areas often relate to burglary and assault when the implications of other factors including age, family, gender, and form of housing are managed. For instance, Aust and Simmons (2002) confirmed that less than 3% of people living in rural areas experienced burglary. Fear of being a victim of crime in terms of feeling unsafe when walking alone after dark in the neighborhood in rural areas was 8% compared to 13% in urban areas (Ceccato, 2015).
Taylor, Eitle, and Russell (2009) reveal that fear of crime is higher among black people compared to whites. The major contributing factor to higher fear of crime among blacks is the fact that race/ethnicity is a substitution for low socio-economic status and social disadvantage both of which increase victimization. For instance, while living in communities with high crime rates, people from minority groups, like the blacks are highly likely to experience high fear of crime. Additionally, like women, people from ethnic minority groups should be afraid of crime since they are less likely to counterattack. Additionally, the ethnic minorities group in Britain has been socialized to be profound to their susceptibilities. For instance, Hooghe and Vroome (2016), reveal that stereotypes towards specific groups of a population contribute to the perception of the group as a threat. According to the Florida Department of Juvenile Justice (2000), the fear of crime was higher among the Hispanic males and females compared to either White non-Hispanic counterparts, or African Americans. The major reason for higher fear of crime among Hispanics than the African Americans has been the higher likelihood of blacks to exercise precautionary measures compared to Hispanics (Menjívar & Bejarano, 2004). Among Hispanic women, the fear of victimization is high owing to their inability of people to understand them especially those who do not speak Spanish. Furthermore, Hispanic immigrants always fear retaliation upon reporting criminal victimization to the lower enforcers.

My research question was there is a relationship between gender, ethnicity, and type of area, and public worry about crime. My null hypotheses: there is no relationship between gender and public worry about crime; there is no relationship between ethnicity and public worry about crime; and there is no relationship between type of area and public worry about crime. I have ensured that the null hypothesis is included in my analysis given that it is required to facilitate proper testing of the significance of the relationship. I hypothesize that personal mastery mediates the relationship between a person’s physical incapacity and fear of crime. Masterly refers to a person’s believe that alterations in the social settings are receptive to and dependent upon their actions, efforts, and choices. Conversely, people with weak personal control perceive that forces outside their own influence shape events in their lives, given their limited capacity to influence what happens to them (Taylor, et al., 2009). The expected result from the study is that women and ethnic minorities have higher fear of crime compared to other groups because of the limited capacity to resist attack and the socialization of these groups as sensitive to crime. Additionally, people living in rural areas are less likely to experience fear of crime compared to their urban counterparts owing to factors such as close-knits among rural dwellers.
Data management
The source of the data was the 2013-14 Crime Survey for England and Wales. The data was collected by United Kingdom from October 2013 to the end of 2014. Additionally, the data was obtained from a random sample of 35371 respondents. From the respondent’s home, face-to-face interviews were used to complete the questionnaires. The reason for the collection of the data was to analyse trends for crime and fear of crime in Britain.

The data variables chosen for the study were, worry about being a victim of crime (named as worryx). Worryx was numerical and measured on a continuous scale. Gender was measured on a nominal scale and categorical in nature. It had two levels namely male coded as 1 and female which was coded as 2. The second data variable was type of area dataset which was categorical in nature and measured on nominal scale. It was categorized into two groups namely: urban which was coded as 1; and rural which was coded as 2. Lastly, ethnicity was nominal in nature and with 5 categories namely: white coded as 1; mixed coded as 2; Asian or Asian British coded as 3; black or black British coded as 4; and Chinese or other coded as 5. All the missing variables in the four datasets were added to discrete miss values box and coded as -99. (Berkman & Reise, 2011)Consequently, all missing values were not part of the valid cases. Before running the test, all the data values were checked to ensure they were all configured to the right measurement scale.
Data analysis
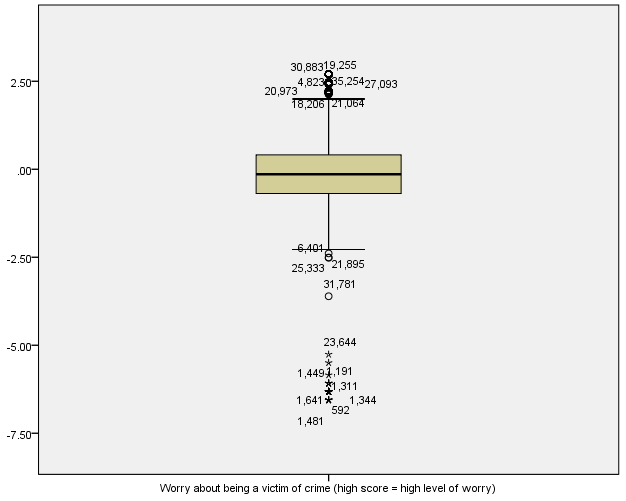
Firstly, we sought to find out whether there existed a linear relationship between gender and worryx. Before running the regression analysis test, a normality test and presence of outliers were checked. From the analysis, worryx variable was found to be skewed to the left (Figure 1). In addition, a closer look on the boxplot revealed that the worryx suffered from outliers as in Figure 2 below.
Figure 1: Histogram of Worry about being a victim of crime data
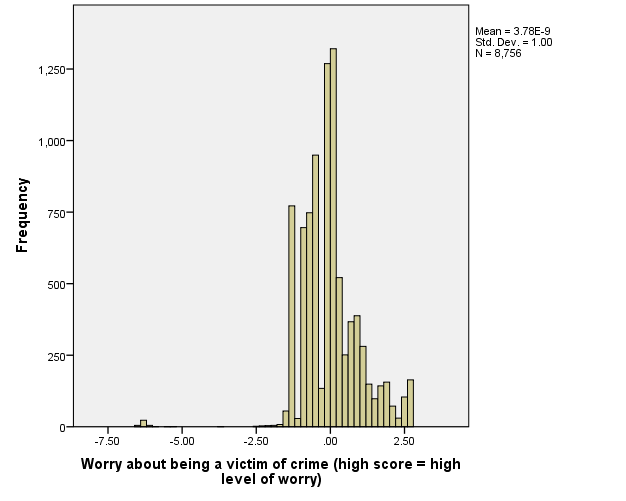
Figure 2: Boxplot of Worry about being a victim of crime data
From the regression analysis test, the descriptive statistics showed that males had a mean worry score of -0.2415, while females had a mean worry score of 0.2003. This clearly indicated that females had a higher mean worry score than males. From the regression analysis in Table 1; F (1, 8754) = 445.037, p = 0.000, the results showed that with a p < 0.05, there was a sufficient statistical evidence to support the claim that a linear relationship between gender and worryx was present (Field, 2013). As a result, the test concluded that gender is linearly associated with worrying about being a victim of crime at 0.05 significance level. The test results were consistent with the scatterplot of gender versus worryx (Figure 3) where we found that there was evidence of a linear relationship between gender and worryx.
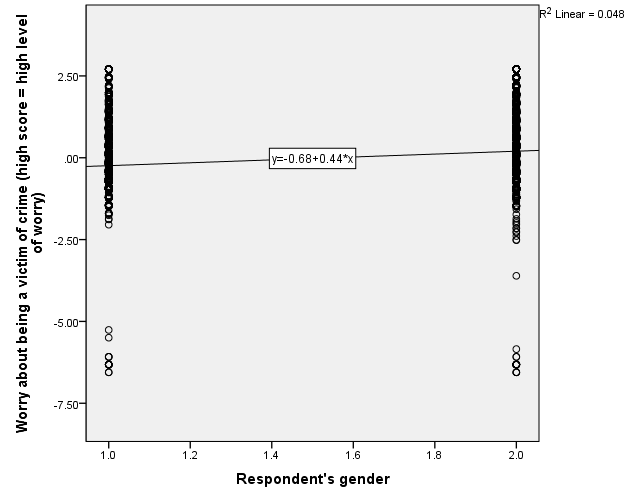
Figure 3: A scatterplot of Worry about being a victim of crime versus gender
| ANOVAa | ||||||
| Model | Sum of Squares | df | Mean Square | F | Sig. | |
| 1 | Regression | 423.555 | 1 | 423.555 | 445.037 | .000b |
| Residual | 8331.445 | 8754 | .952 | |||
| Total | 8755.000 | 8755 | ||||
| a. Dependent Variable: Worry about being a victim of crime (high score = high level of worry) | ||||||
| b. Predictors: (Constant), Respondent’s gender | ||||||
Table 1: Gender versus worryx ANOVA output
| Coefficientsa | ||||||
| Model | Unstandardized Coefficients | Standardized Coefficients | t | Sig. | ||
| B | Std. Error | Beta | ||||
| 1 | (Constant) | -.683 | .034 | -20.081 | .000 | |
| Respondent’s gender | .442 | .021 | .220 | 21.096 | .000 | |
| a. Dependent Variable: Worry about being a victim of crime (high score = high level of worry) | ||||||
Table 2: Coefficients table for worryx dataset
The second hypothesis test was to find out whether there existed a linear relationship between worrying about being a victim of crime and residential area (whether urban or rural). With F (1, 8754) = 214.696, p = 0.000 (Table 3). The error bars of type of area by worryx revealed that respondents who lived in urban areas were more worried about being victims of crime compared to respondents who lived in rural areas. A scatterplot of type of area versus worryx showed evidence of linear relationship between worryx and type of area (Figure 5) (Marques, 2013).
| ANOVAa | ||||||
| Model | Sum of Squares | df | Mean Square | F | Sig. | |
| 1 | Regression | 209.580 | 1 | 209.580 | 214.696 | .000b |
| Residual | 8545.420 | 8754 | .976 | |||
| Total | 8755.000 | 8755 | ||||
| a. Dependent Variable: Worry about being a victim of crime (high score = high level of worry) | ||||||
| b. Predictors: (Constant), Type of area 2004: urban/rural | ||||||
Table 3: Type of area by worryx ANOVA dataset
| Coefficientsa | ||||||
| Model | Unstandardized Coefficients | Standardized Coefficients | t | Sig. | ||
| B | Std. Error | Beta | ||||
| 1 | (Constant) | .450 | .032 | 13.856 | .000 | |
| Type of area 2004: urban/rural | -.364 | .025 | -.155 | -14.652 | .000 | |
| a. Dependent Variable: Worry about being a victim of crime (high score = high level of worry) | ||||||
Table 4: Coefficients of worryx data set
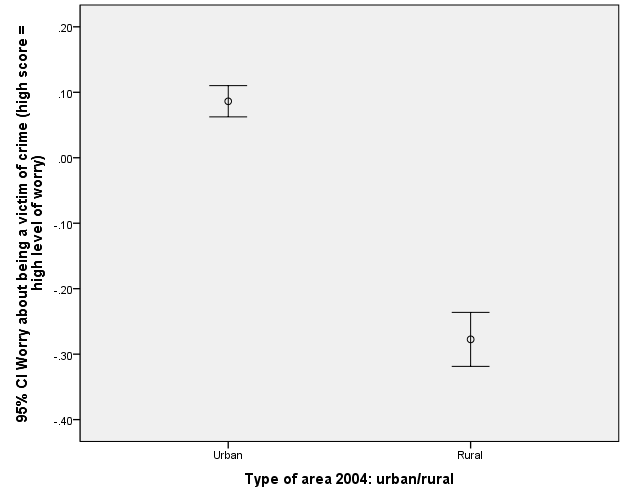
Figure 4: Type of area by worryx error bar chart
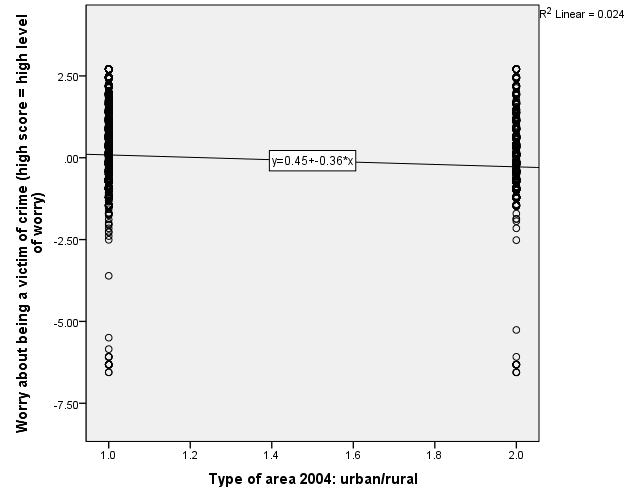
Figure 5: Type of area by worryx scatterplot
The third and last hypothesis testing was to find out whether there existed a linear relationship between ethnicity and worryx. From the findings, a correlation coefficient of r (8752) = .178, p < 0.001 implied that there was a linear association between ethnicity and worrying about being a victim of crime (Table 5) (Pallant, 2010).
| Correlations | |||
| Worry about being a victim of crime (high score = high level of worry) | Respondent’s ethnic origin (5 categories) | ||
| Worry about being a victim of crime (high score = high level of worry) | Pearson Correlation | 1 | .178** |
| Sig. (2-tailed) | .000 | ||
| N | 8756 | 8752 | |
| Respondent’s ethnic origin (5 categories) | Pearson Correlation | .178** | 1 |
| Sig. (2-tailed) | .000 | ||
| N | 8752 | 35338 | |
| **. Correlation is significant at the 0.01 level (2-tailed). | |||
Table 5: correlation matrix of ethnicity by worryx
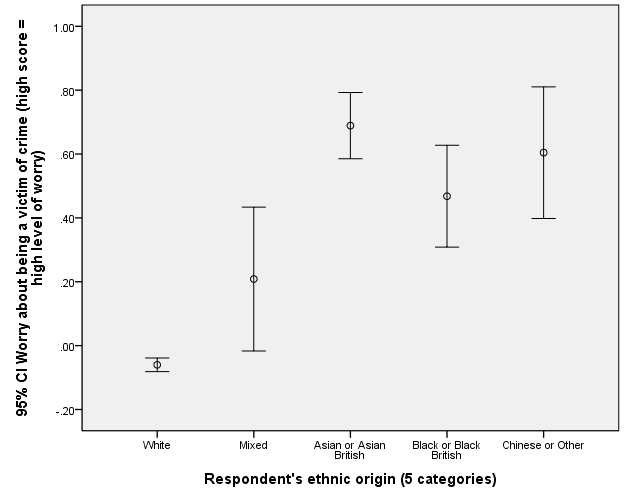
Figure 6: Ethnicity vs. worryx error chart
From Figure 6, it was evident that white race were the least likely to be worried about being victims of crime while Chinese/other and Asian or Asian British were the most likely to be worried of being victims of crime.
Conclusion
From the analysis, there was evidence of linear relationship between gender and worrying about being victim of crime (p < 0.05). Females were more worried about being victims of crime compared to men. In addition, there was a linear relationship between type of area and worrying about victim of crime; respondents who lived in urban areas were more worried about being victims of crime compared to respondents who lived in rural areas (p < 0.05). Furthermore, there was also evidence of linear association between ethnicity and worrying about being victim of crime (p < 0.05). As such, the null hypothesis that there was no linear relationship between gender, ethnicity, and type of area were all rejected at 0.05 alpha levels. I found what I expected because gender, whether one is male or female; ethnicity; and type of area one resides, rural or urban area, are crucial factors in understanding public perception about crime.
Limitation of the data was that the worry about being a victim of crime data was not normally distributed, suffered from presence of outliers and had a lot of missing data. In addition, type of area dataset was not very explicit as most urban areas have two categories namely high class areas and low class areas and as such we would expect high class areas to be free of crime due to tight security and high income of individuals.
We can do it today.
- Aust, R. & Simmons, J., 2002. Rural Crime: England and Wales, UK: British Crime Survey.
- Barkan, S., 2011. Sociology: Understanding and Changing the Social World. United States: Flat World Knowledge, Inc.
- Berkman, E. T. & Reise, S. P., 2011. A Conceptual Guide to Statistics Using SPSS. New York: SAGE.
- Bridge, S., 2013. Live in the country? Then you’re happier than your city-dwelling friends… Rural folk more optimistic than those in urban areas. The Mail, 15 October.
- Ceccato, V., 2015. Rural Crime and Community Safety. London: Routledge.
- Field, A., 2013. Discovering Statistics Using IBM SPSS Statistics. New York: SAGE.
- Florida Department of Juvenile Justice, 2000. Fear of Crime and Related Perceptions in Florida 1998, Florida: Bureau of Data and Research, Research Digest.
- Hilinski, C., 2009. Fear of crime among college students: A test of the shadow of sexual assault hypothesis. American Journal of Criminal Justice, Volume 84, pp. 84-102.
- Hooghe, M. & Vroome, T., 2016. The relation between ethnic diversity and fear of crime: An analysis of police records and survey data in Belgian communities. International Journal of Intercultural Relations, Volume 50, pp. 66-75.
- Laerd Statistics, 2017. Chi-Square Test for Association using SPSS Statistics. [Online]
Available at: https://statistics.laerd.com/spss-tutorials/chi-square-test-for-association-using-spss-statistics.php - Lane, J., 2012. Theoretical explanations for gender differences in fear of crime. United States: Routledge Internationa.
- Marques, J. P. d. S., 2013. Applied Statistics Using SPSS, STATISTICA and MATLAB. Berlin: Springer Science & Business Media.
- Menjívar, C. & Bejarano, C., 2004. Latino Immigrants’ Perceptions of Crime and Police Authorities in the United States: A Case Study from the Phoenix Metropolitan Area. Ethnic and Racial Studies, Volume 27, p. 120–148.
- Pallant, J., 2010. SPSS Survival Manual: A step by step guide to data analysis using SPSS. Crows Nest: Allen & Unwin.
- Taylor, J., Eitle, D. & Russell, D., 2009. Racial/ethnic variation in the relationship between physical limitation and fear of crime: An examination of mediating and moderating factors. Deviant Behav, 30(2), pp. 144-174.